
© 2026 Monument Traders Alliance, LLC

The headlines are starting to get loud.
Everyone’s hearing the talking heads on TV deliver the message like a town crier warning of an attack…
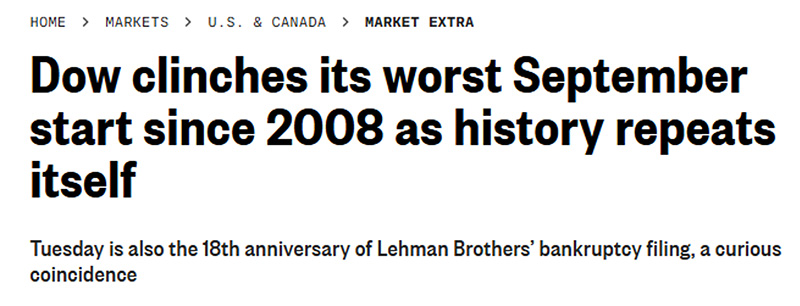
The Dow is down 2.1% through the first ten trading days of September, its worst start to the month since 2008.
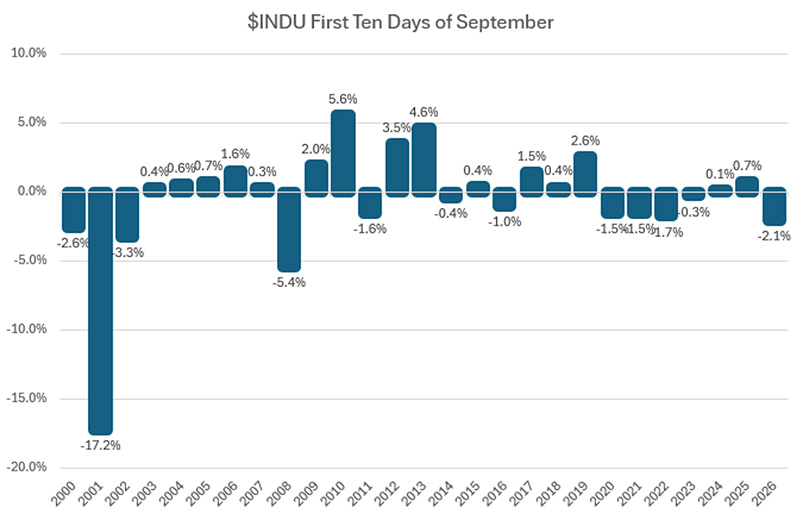
That sounds ominous, especially when you attach “2008” to anything involving the stock market. That’s their point. Halloween’s still over a month away, but they want you scared today.
But the data needs some perspective.
The S&P 500 is down 1.3% over the same period, while the Nasdaq 100 is down 1.8%.
More importantly, we’ve already seen stretches like this in 2026. The Dow fell 4.9% during the first ten trading days of March, while the S&P 500 dropped 3.6%. The Nasdaq 100 fell 3.2% during the first ten trading days of February.
Those two months, like September and October, are the toughest months of every year in terms of seasonality.
In other words, September has been weak, but it hasn’t been extraordinary.
Let’s dig deeper into the seasonality angle.
Over the last 20 years, the Dow has averaged a 0.5% decline during the first ten trading days of September. The month has a long history of stepping into a hole right out of the gate.
What happens next is more interesting.
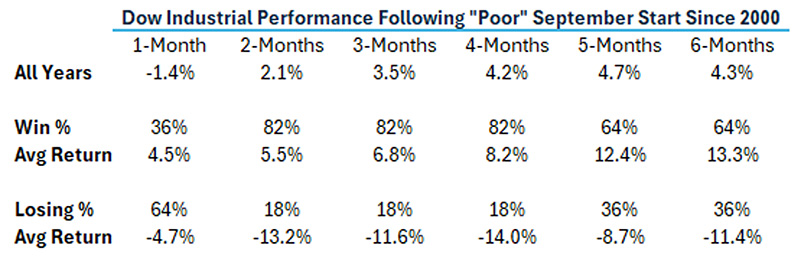
Since 2000, there have been 11 Septembers, including this year, when the Dow posted a negative return during the first ten trading days.
Historically, the weakness has tended to persist over the following month, with the Dow declining 64% of the time.
But stretch the timeline out and the picture changes quickly.
Two months after these weak September starts, the Dow has averaged a 2.1% gain and traded higher 82% of the time.
That bullish bias continues through the three- and four-month windows before weakening as we approach February, which happens to be another historically difficult seasonal period for stocks.
The table below breaks down the Dow’s performance following a negative start to the month of September.
This doesn’t mean we ignore interest rates, geopolitical risk, energy prices, AI spending, or any of the other uncertainties currently hanging over the market. Those risks are real.
But risk and trend are two different things.
Matt McCall made this point during his first MTA Live appearance: financial media is competing for eyeballs. Traders need to focus on what the market is actually telling them rather than allowing a headline to dictate their outlook.
Nobody is talking about this…
I’ve been using sentiment as an indicator since 1999, including the VIX and CBOE put/call ratio, Barron’s magazine covers, media headlines, and analyst buy ratings.
This may be the tallest “Wall of Worry” I’ve seen.
Eventually that wall will matter.
Longer-term trends will roll over, support will break and the technical picture will tell us that conditions have changed. Trying to predict that turn in real time, however, is usually a losing battle. Just ask Alan Greenspan and Abby Joseph Cohen.
We’re not there yet.
For now, we need to treat dips and volatility as what they are: opportunity generators until the longer-term trends begin to reverse.
Watch the trend, watch support, watch volatility, and let the market tell you when something has actually changed.
P.S. Everything above comes down to one idea: dips and volatility aren’t the enemy; they create opportunities until the trend actually breaks. The hard part is catching that shift before the crowd does, instead of after the headline already told you about it.
That’s the exact gap Bryan Bottarelli built his Flash Rally system to close. Instead of watching a chart and hoping you’re timing is right, his AI-powered scanner is designed to flag down-day setups as they’re forming.
He walked through the whole system live yesterday afternoon. If you missed it, you can catch the replay here. Well worth your time before the next “Wall of Worry” headline tries to talk you out of a good setup.
